
Where Data Meets Insights - Right at Your Fingertips
About Me


Delivering actionable insights that drives data-driven decision making starts with requirement gathering. Here is my approach to data analytics, what I do during each stage, and Tech tools/skills used.
With a background in Customer experience,I am skilled in the use of Microsoft outlook/ Teams in communicating with stakeholders to identify and understand business needs, and document the analysis requirements using Microsoft word / OneNote for referencing throughout the project duration.

Leveraging my keen eye for detail, I efficiently collect and combine necessary data from various sources such as databases, web, or flat files by writing SQL queries, Using data import in Excel, or Power Query in MS Excel/Power BI to connect to multiple data sources and extract data.
As a DataCamp Certified data analyst, I have experience in data cleaning, creating new variables, filtering and summarizing data using data definition/ manipulation languages (DDL/DML) in SQL, Advanced functions, formulas, and pivot tables in MS Excel; and Power Query and DAX in Power BI, to enhance Exploratory data analysis (EDA).
I am a Microsoft Power BI certified Data Analyst, proficient in creating interactive dashboards and reports using Power BI. My ability to visualize complex data sets helps in uncovering trends and patterns that drive business intelligence. I'm also skilled in the use of Microsoft Excel to create dynamic visualizations that cater to different audience needs.

My strong communication skills enable me to effectively interpret and communicate data insights and findings to stakeholders, incorporating data storytelling techniques to make the data more relatable and persuasive. I utilize MS PowerPoint to create engaging slideshows and MS Word to document comprehensive analysis and insights.
![]()
Here’s how I’ve been solving real problems with data
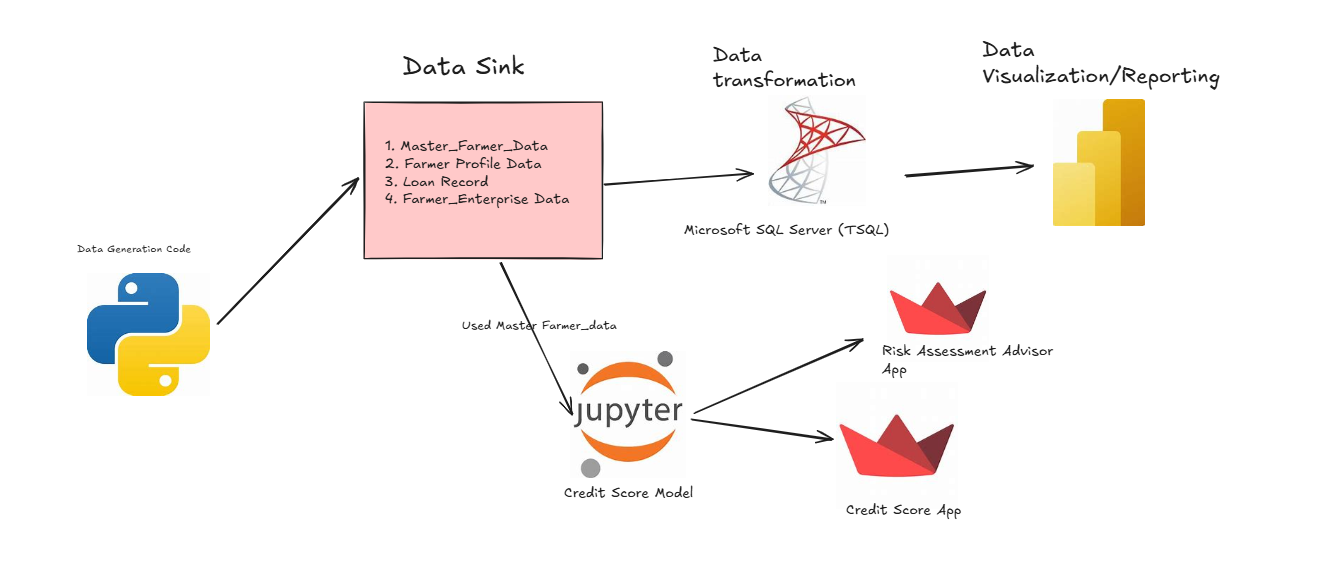
Problem: Only 27% of rural adults in Nigeria and just 6% of young entrepreneurs (ages 18–25) have access to business loans, with agriculture viewed as too risky by lenders.
What We Did: Designed a modular solution with predictive credit scoring and risk assessment tools, integrating datasets on farmer demographics, production, climate, markets, and loan history.
My Role: Led the data analytics workflow: cleaned and merged datasets, ran exploratory analysis, and built interactive Power BI dashboards to clarify profiles of credit-worthy farmers.
Impact: The prototype demonstrated how data-driven insights could reduce perceived lending risks and potentially improve financial inclusion for young farmers.
View Project Interact with Dashboard
Problem: Limited visibility into sales, profit, and discount performance across products, segments, and regions, resulting in missed opportunities for growth and profitability.
What I Did: Cleaned raw data, performed exploratory analysis and visualized US Superstore data in Power BI to monitor sales, profit, and discount trends.
Impact: Revealed top-performing segments and profit leakage from excessive discounts, supporting targeted sales and margin improvement strategies.
View Project Interact with Dashboard
Problem: High Customer churn was happening without clear insight into which customer groups were at risk and why.
What I Did: Performed ETL on the data & Created Power BI dashboards to analyze churn by profile, demographic, billing method, and subscription plan.
Impact: Identified Customer categories with high-risk for Churn (e.g. Fibre Optic internet subscribers), enabling proactive & targeted retention strategies.
View Project Interact with Dashboard
Problem: Despite diversity initiatives, the telecom client’s executive leadership remained gender-imbalanced, indicating a misalignment between intent and measurable progress.
What I Did: Built a Power BI dashboard tracking gender metrics across hiring, promotions, and turnover, while defining KPIs and visualizing disparities in performance and advancement.
Impact: Revealed promotion and employment type biases as potential root causes, enabling actionable recommendations to promote equity and improve gender balance in the C-Suite.
View Project Interact with Dashboard
Problem: Limited visibility into customer and agent behavior trends hindered the call center manager’s ability to identify performance issues, optimize operations, and sustain a competitive business edge.
What I Did: Performed ETL, Analysed the data and built Power BI dashboard tracking Agent performance & customer satisfation.
Impact: Revealed customer engagement peak times and Agent performance gaps, thereby enhancing customer satisfaction and optimizing staffing and training.
View Project Interact with Dashboard
Problem: Marketing Team lacked insight into which products and sales channel actually drove engagement and revenues.
What I Did: Cleaned and explored campaign data in Microsoft Excel to analyse purchases and revenue performance across products and channels.
Impact: Revealed best selling products and top sales channel, improving campaign strategies and budget allocation.
View Project
Problem: Inconsistent and duplicate values in FIFA 21 data prevented accurate analysis.
What I Did: Used SQL to clean, normalize, and dedupe the dataset for analytics readiness.
Impact: Delivered a clean, analysis-ready dataset, accelerating performance and trend analysis.
View Project Github
 LinkedIn
 Twitter
 Email
Email